Cleaned the anemometer and replaced the backup battery today. Sensor appears to be in good shape.
Cleaned the anemometer and replaced the backup battery today. Sensor appears to be in good shape.
Been 3 years since I installed the new weather station and I haven’t done any maintenance on it. So it was long over due.
The 11:30am to 1pm data for outside temp and humidity today will be missing as the sensors were offline.
New batteries for the 24 hour Fan-Aspirated Shield. This should hopefully correct temperature readings as the old batteries were not keeping the fan running 24/7 anymore.
New backup battery for the temperature/humidity/rain collector.
Full cleaning and wipe down for the Intergrated Sensor Suite.
In check the console’s battery and signal reception of the station, I somehow reset the console, so today’s historic data was reset.
June wasn’t our monsoon season that we often have. With only 50.5mm of rainfall record and of that 50mm, 20mm was a localized 1 hour downpour. Same storm but just 2km north received 20mm less rain during that storm. That weather station only recorded 27.2mm of rainfall for June.
Start conserving water. Going to be a dry summer. I’m surprised we don’t have any water restriction yet.
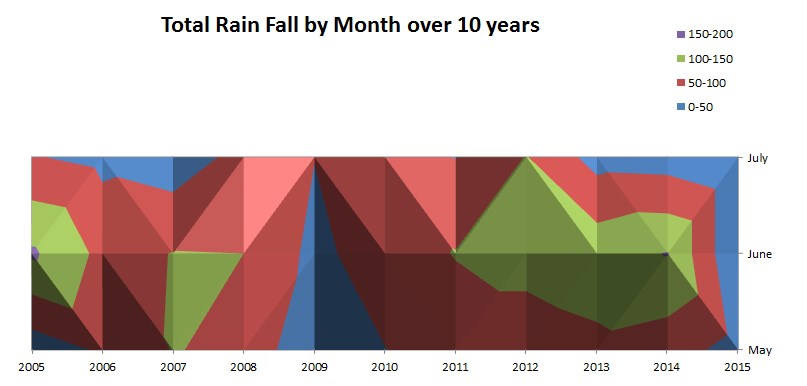
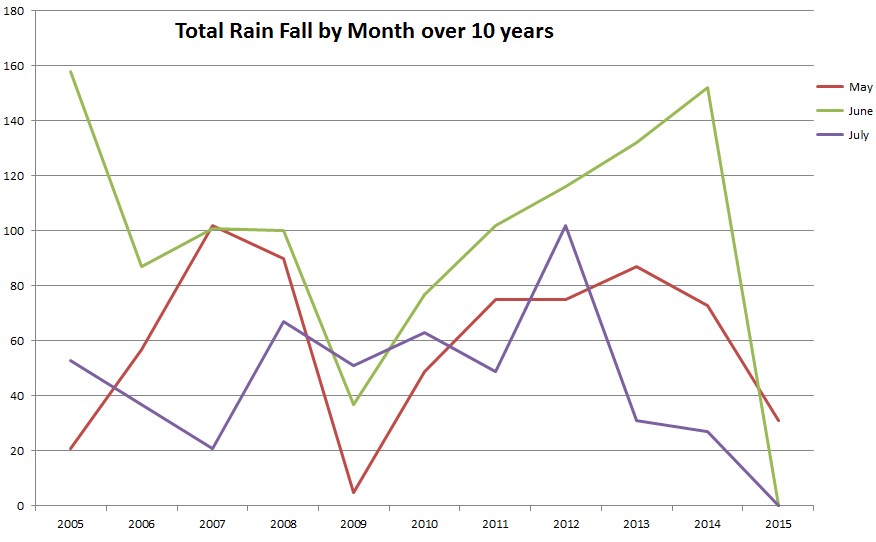
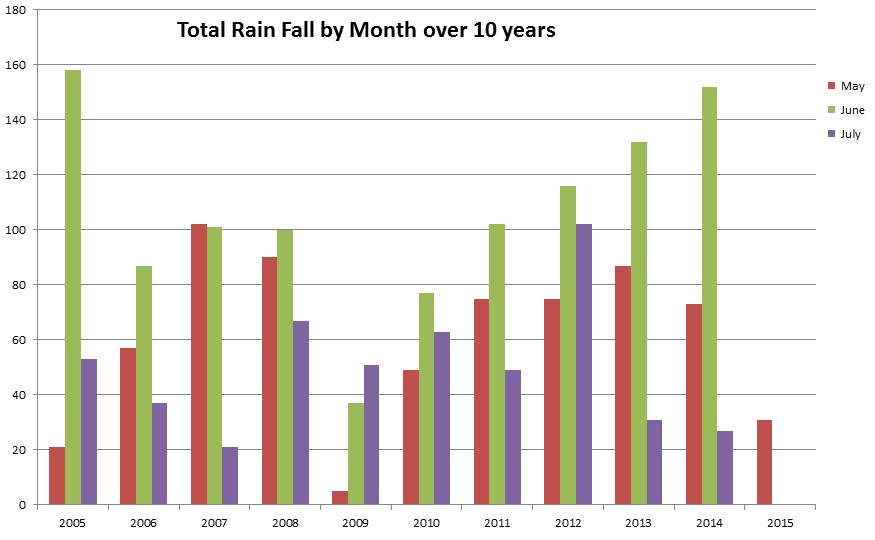
Historically, at least since I’ve lived in Central Alberta, the end of May and early June is usually wet. Here is looking back at the records I’ve measured:
| Year | May | June | July |
| 2005 | 21mm | 158mm | 53mm |
| 2006 | 57mm | 87mm | 37mm |
| 2007 | 102mm | 101mm | 21mm |
| 2008 | 90mm | 100mm | 67mm |
| 2009 | 5mm | 37mm | 51mm |
| 2010 | 49mm | 77mm | 63mm |
| 2011 | 75mm | 102mm | 49mm |
| 2012 | 75mm | 116mm | 102mm |
| 2013 | 87mm | 132mm | 31mm |
| 2014 | 73mm | 152mm | 27mm |
| 2015 | 31mm | ?mm | ?mm |
Few graphs showing the data: (click to enlarge)
My predictions: Going to be a dry summer. Maybe 70-90mm for June?
Interesting that since 2009 our June rainfall total has continue to rise each year by 20mm or more. Is that due to more cloud seeding?
Was puzzled why the wind speed was reporting nothing but the plants in the yard where swaying. Looking up at anemometer I found it twisted 45 degrees and all muddy.
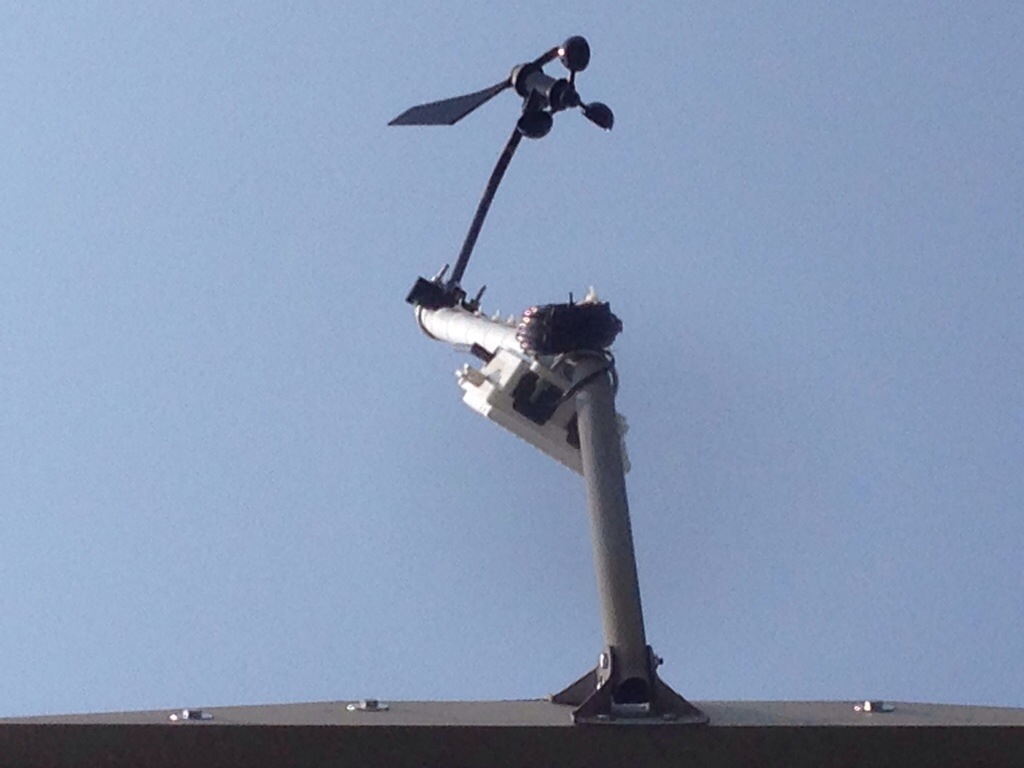
Below was a nice mess to clean up

This happen sometime overnight and was corrected by 10:45am.
This has been a first for my weather equipment in the last 9 years.
Enjoy the warm weather!
The new weather station is now broadcasting current weather information to the Internet.
Upload your bookmarks to: https://www.didsburywx.ca/
Currently I’m going to use the Davis WeatherLink website to make the information available. In the coming days, I’ll start uploading to WUnderground Weather site to provide access to historic data and graphing. Also WUnderground now has a very nice iPhone and Android app that can display my weather station with forecasts and radar images. I’ll provide information on setup once this is ready. I’ve also enabled the skycam image. This image is uploaded every 5 minutes and is point West NorthWest.
Current Image:

I have plans for additional content and formating of the data which I’ll continue to work on when I have time.
Enjoy – Jeff
There will be some massive disruptions to the live weather conditions over the next few weeks. The new weather station has arrived and I’m in the process of getting it setup and configured. This is just in time as the old one which has been in operations since February 2005 has become very brittle. I was gently cleaning a spider web off the anemometer just last week and ended up breaking one of the wind cups. Lucky some Crazy Glue fixed it.
After a fair bit of research and consideration about mounting options, I’ve mounted the new anemometer 6+ feet above the roof line with a full 360 degree reading. Old one was mounted on the fence which had poor reading from the south.
I’ve gone with a satellite mounting bracket with a PVC extension tube with a wood insert. Didn’t want to put holes in the roof and didn’t want to create a lightning rod. I’m monitoring the setup as there is a little bit of sway in winds over 20km/h. The base is very stable up till about 3-4 feet in height. Currently the new wind reading have had better accuracy.

I’m still working on placement of the rain bucket and temperature module. I’m also testing a new “skycam” setup and will hopefully have a eye to the sky with the new site.
The current Live Weather Conditions site is still displaying the data from the old station.
Stay tuned, Cheers Jeff
View large amount of data quickly and meaningful can be difficult to do. Some bright minds have come up with an interesting way in showingcurrent wind flow over the United States. Just need a Canada version now.
Check it out here: http://hint.fm/wind/
Sample Image (Website link has animated version):

A while back I decided to ditch the old site templates and setup that I used to run the “Olds Alberta Weather Station” site. Reason, my weather station hardware is nearing retirement and the software used for the site only works with that weather station. So rather than reworking the templates and setup for the new location, I’ve dumped it and will start fresh.
I’ve decided to try Cumulus from Sandaysoft as the weather station monitoring software. I had looked at it back in 2007 or 2008, but to move off the FreeWX-Wi was too much work at the time. The big benefit for me now is Cumulus supports multiple weather stations, so I can change to a new weather station (hopefully in the coming months) without having to recode the website. Another big benefit with Cumulus is its nice starter package of web templates. Without much work, the main site is up, a fancy gauge version, and an iPhone site. I’m still missing lots of the data that I use to show, but I can slowly build upon this. With my current time to this project very limited over the last year and foreseeable future, this allows me to share the current weather conditions without a lot of work.
Because I’m not running the web server in my home anymore, the uploads to the main website is not every minute, but every ten minutes. This is due to bandwidth issues with the graphs and html pages. The Silverlight desktop version only uses a small text file, so that file I can upload more often. I’ll probably eventually run it in-house again, but for the meantime, this is easier to support. The likelihood of disconnect between the weather station and the web site is much greater now, so watch the conditions date and time.
Happy weather watching, Jeff
Couple of website for historic data view that I’ve been using for a while and thought I would pass them along to you.
Data for graphs below were provided from Alberta AgroClimatic Information Services.
Click on image to enlarge.

The average temperature this past winter has been a good couple degrees warmer than the historic average.
Looking at the lowest temperatures…
